Tuesday, November 15, 2016

Atlanta Airport Guide

            There’s an old joke in the South that when you die, if you want to get to heaven or hell you have to go through Atlanta first. There is, of course, truth to that old joke as Atlanta’s Hartsfield-Jackson International Airport saw one hundred million passengers pass through last year and has been the busiest airport in the world since 1998. On any given day, one thousand flights take off from Atlanta with over two hundred sixty thousand passengers moving through the airport. Hartsfield-Jackson serves as the headquarters of Delta Airlines and is a major Delta hub for the southeastern United States, the Caribbean, and Europe. Delta’s traffic accounts for nearly 75% of the airport’s passenger traffic, while lower cost airlines like Southwest, Frontier, and Spirit make up much of the rest. Chances are, if you’ve ever flown domestically, you’ve flown through Atlanta at least once. With that in mind, we figured it might be a good idea to over some travel tips for navigating your way through this busy thoroughfare.

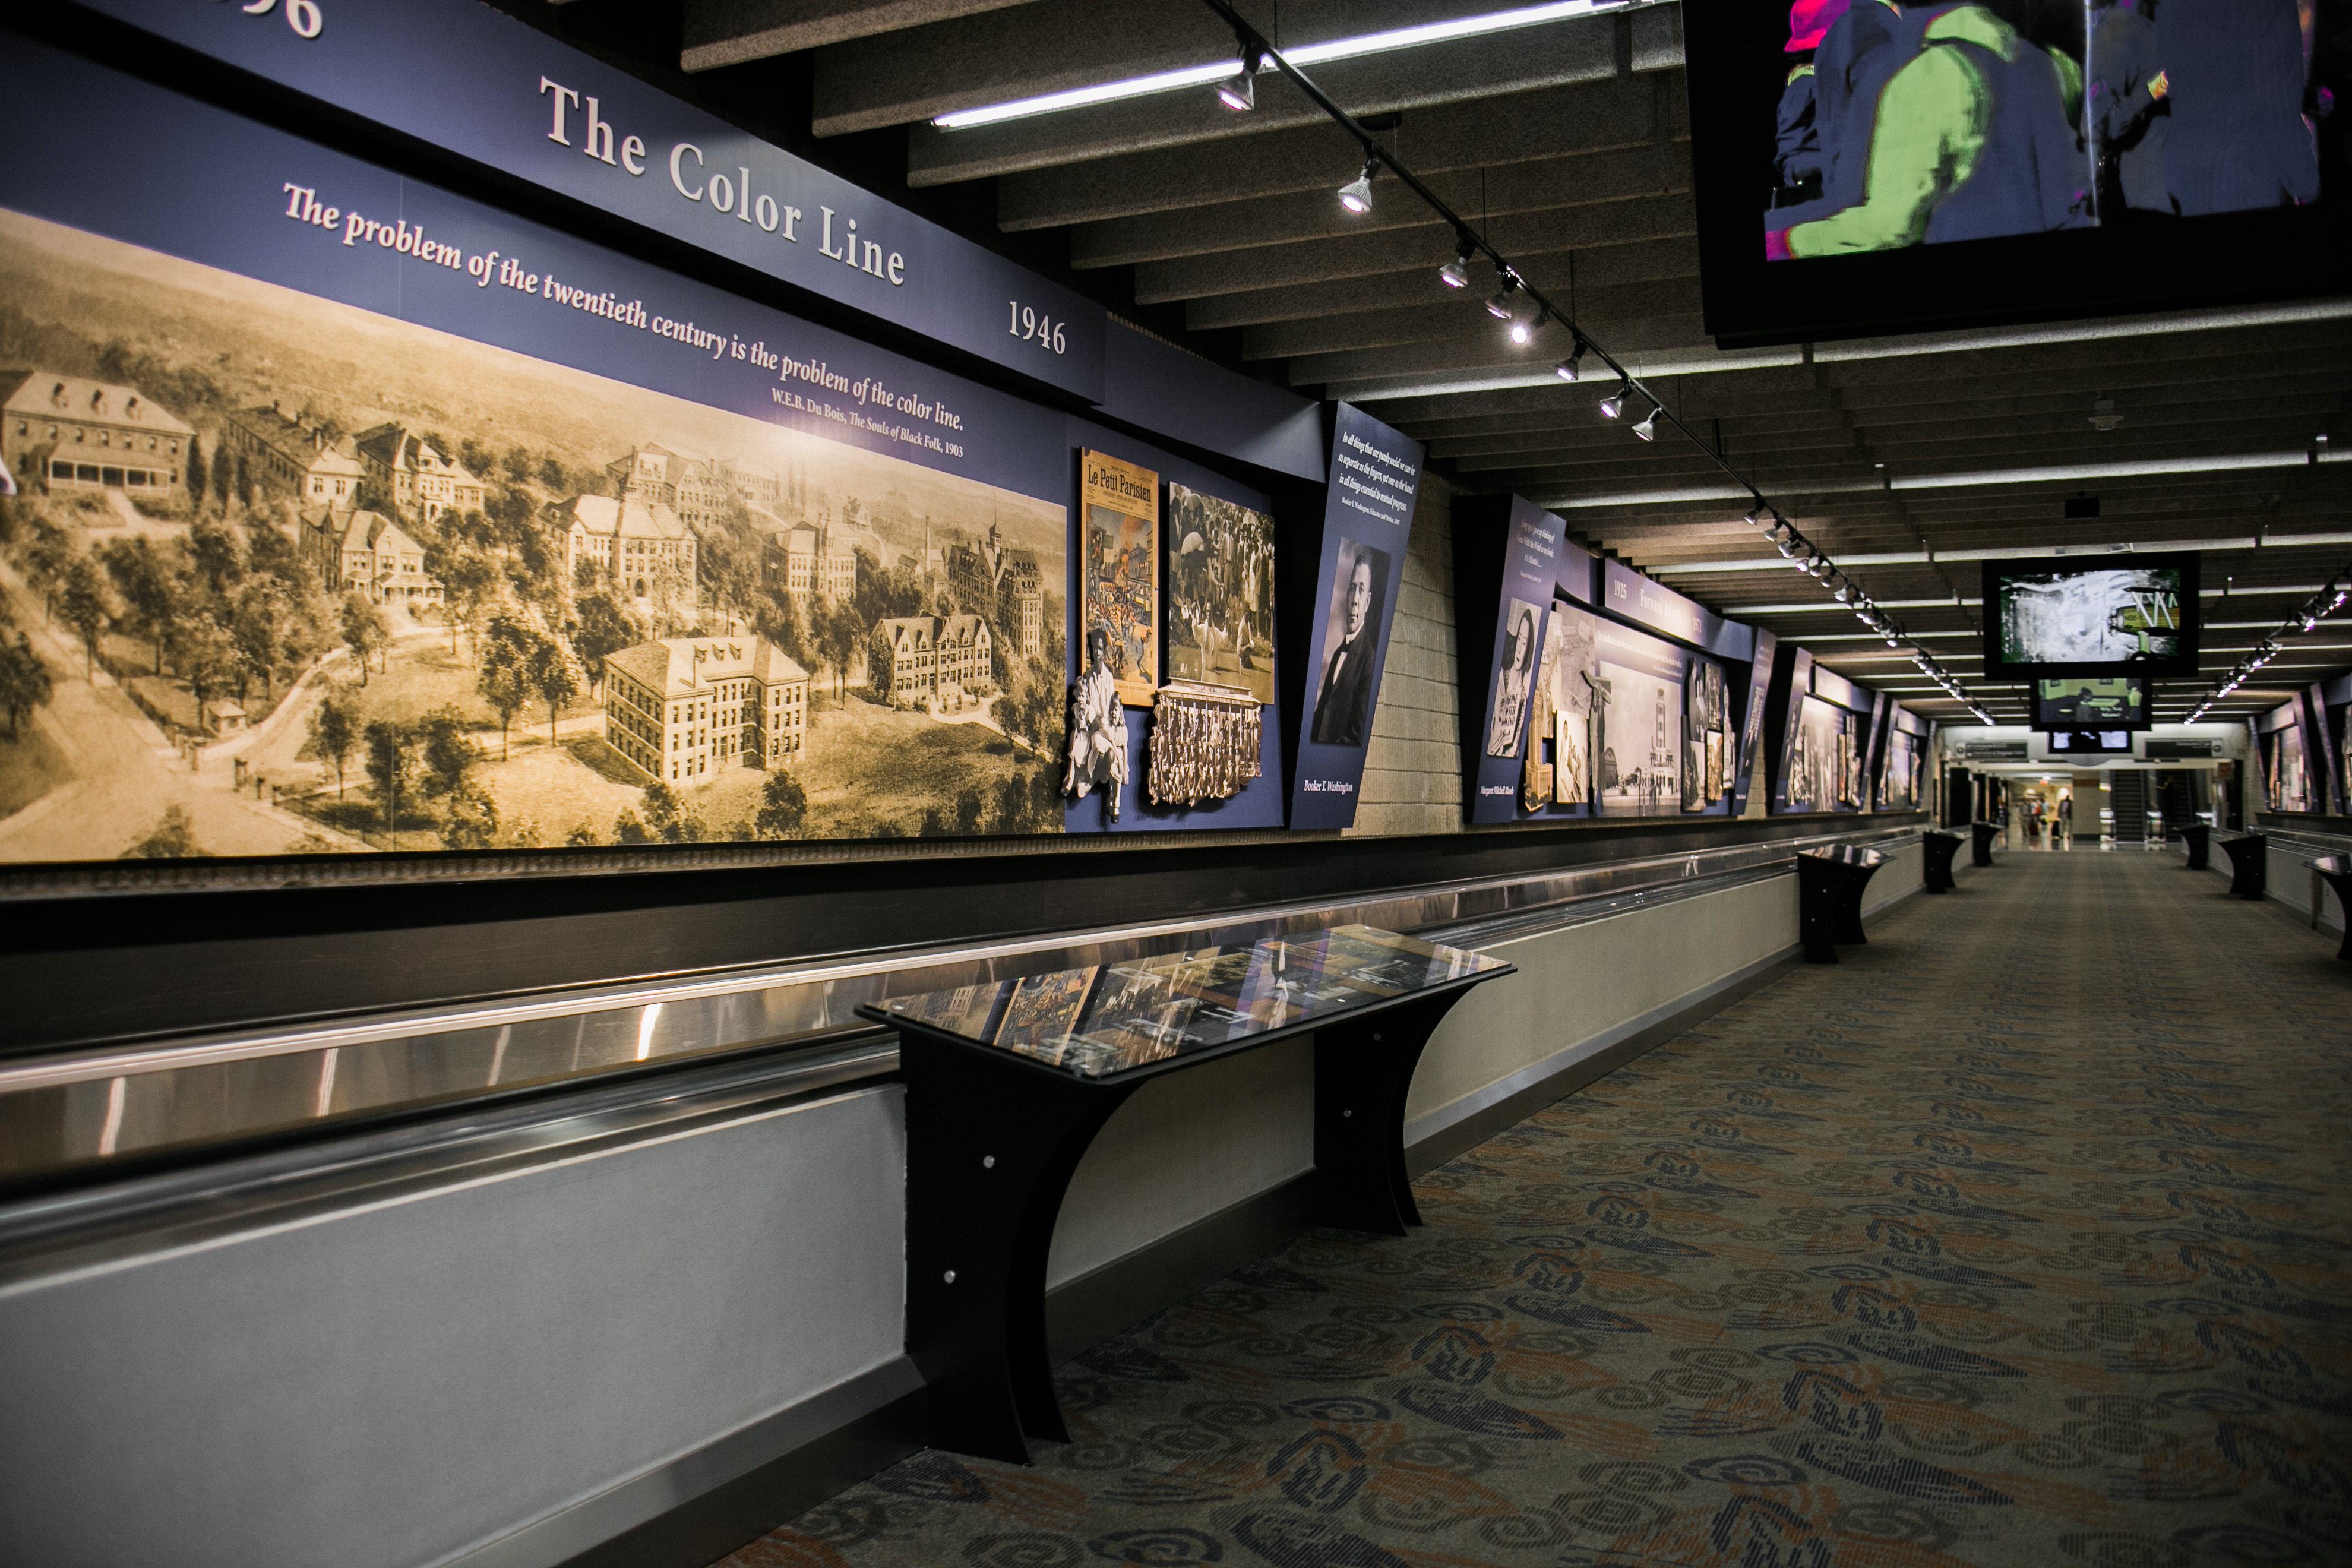
            If you’re flying through the Hartsfield-Jackson, navigating the ariport is relatively easy—at least after you realize that the T terminal comes before the A Terminal. The internal automated train known as the “Plane Train” runs passengers quickly and efficiently between the terminals. For those who don’t want to take the “Plane Train,” you can walk between the terminals. These walkways include a series of artistic and historical exhibitions that highlight local artists and the history of Atlanta. They are well worth your time if you have a long layover. The permanent exhibits are in the corridor between the T and A corridors. The History of Atlanta is on the walkthrough between B and C. There are other art exhibitions in T concourse and in the atriums of the various terminals.  

            Most importantly though is being able to navigate your way through the Atlanta airport’s copious food options. Like any airport, Hartsfield-Jackson has your standard fast-food: McDonald’s, Chick-Fil-A, and pretty much every mediocre food joint you could imagine, but if you go looking for them, you can find a few local gems that won’t necessarily break the bank and offer a good meal in return. With that in mind, here are four food options that you won’t regret later.

Varasano’s-Terminal A—This Atlanta based pizza restaurant has an outpost in Terminal A. The best part of Varasano’s is their thin and crispy crust topped with quality ingredients. The house special is called “Nana’s” and it features mozzarella cheese, san marzano tomatoes and herbs. Another favorite is the “Bufafa and Coppa” a pizza made with imported buffalo mozzarella cheese, basil and capicola (a pork cold cut consisting of dry cured meat from the neck or shoulder). There’s a piano bar and views of the activity bustling around the T Terminal across the way.

Pascal's Award Winning Fried Chicken

Paschal’s Southern Cuisine-Terminal B Concourse- The Paschal’s in Atlanta has been open since 1947 where it served as a meeting place for musicians like Aretha Franklin and Dizzy Gillespie and  famed civil rights leaders like Martin Luther King Jr. and John Lewis. In 2015, the Atlanta Journal Constitution named Pascal’s fried chicken the best in the state. The Pascal’s at Hartsfield-Jackson has been filling the bellies of travelers with its fried chicken, catfish, mac and cheese and other southern soul food delicacies since 1979.

Grindhouse Killer Burgers D-Terminal Gate 30- A small local burger chain that opened its first location in 2009, Grindhouse burgers rely on locally sourced ingredients that let them stand above your standard airport burger options. Grindhouse has a selection of house burgers while also allowing you to build your own. They have an expansive selection of local beers and a location that is just out of the way to allow you to stretch out and relax in a quieter part of the airport.


 One Flew South-Terminal E- One Flew South is considered one of the best airport restaurants in the world. In 2014, it garnered a James Beard nomination for Best Restaurant Southeast. The New Orleans based Tales of the Cocktail named it the best airport bar in the world. In 2013, Frommer’s ranked One Flew South as one of the top 10 U.S. airport restaurants. The menu includes items like a pulled duck sandwich, thyme roasted pork belly, and lamb ragout with rigatoni pasta. If you have the time and the money, it is possible to have a really nice meal at the Hartsfield-Jackson airport. 

Tuesday, November 8, 2016

New Orleans to Europe Direct Flights! Coming this Spring!

            In the past few months, British Airways and Condor Airlines have announced plans to begin direct flights from New Orleans to London’s Heathrow Airport and Frankfurt, Germany. The flights, set to begin in the spring, will be the first direct flights to Europe from Louis Armstrong International Airport since 1982. The opening of these two routes is the result of years of work by the New Orleans Convention and Visitors Bureau, Greater New Orleans Inc., a regional economic development group, local and state government, and the representatives of the airport itself. The Convention Bureau established an office in London and lobbied tour operators, travel agents, and travel brokers to create a demand for direct flights to New Orleans. Last year, New Orleans was on the short list to receive a British Airways direct to London flight but lost out to San Jose, as British Airways viewed Silicon Valley as a more attractive option. They worried that business travelers, who pay more for tickets and travel more frequently than seasonal travelers, would not have as much a demand to travel to New Orleans.


             The opening of these new routes shows that New Orleans’ investments in the tourism industry after Hurricane Katrina have begun to pay off. Louis Armstrong International Airport is in the midst of spending nearly one billion dollars to construct a new state of the art terminal, set to open in 2018. Last year, the airport had 10.7 million passengers, the most in its seventy year history. Visitors to New Orleans spent a record seven billion dollars in 2015 and by opening direct international routes New Orleans opens itself up to even more tourist revenue. International travelers tend to spend longer in their destinations, up to 3 weeks, and spend more money overall than domestic travelers. Tapping into this high end travel market will open up a line of revenue into the city and state’s coffers. Additionally, the opening up of these routes means that travelers won’t have to fly to Atlanta, Houston, or Dallas before heading to Europe. London and Frankfurt, besides being desirable destinations on their own, are hubs to pretty much anywhere in Europe.

            The opening of these routes is also the result of profound changes in the airline industry. For anyone who follows the airline industry closely (something I’m sure you all do), it was no surprise that British Airways announced that the Boeing 787 Dreamliner would fly the London-New Orleans route.  This plane, first designed in the late 1990s after Boeing saw a decline in orders for its larger long haul airplanes, represents the latest trend in aviation. Following the terrorist attacks of September 11 and the spike in fuel prices in the 2000s, airlines valued fuel efficiency over speed. The Dreamliner offers excellent fuel efficiency—102 miles per gallon per seat—it is also light, and has an operational range of 8,000 miles. While it only carries 220 passengers, the other bonuses of the plane make up for its smaller seating capacity. The existence of the Dreamliner with its fuel efficiency and long operational range signals the triumph of point-to-point flying over the old hub-and-spoke model.


In past decades and exemplified by planes like Airbus’s A380—the largest ever passenger plane that holds 615 people on two separate floors—airlines operated on the hub-and-spoke model. In this model, for long distances say across the United States, airlines operated one hub on each coast, say New York and Los Angeles. If you were on the East Coast and needed to get to the West Coast you had to fly from wherever you were to New York and then to L.A. This was great for airlines as they had fewer routes to maintain and could pack their planes full, but it also drove up costs as it’s really expensive to operate out of major hubs with higher airport fees, cost of ground staff, terminal space, and other associated costs. 

The 787 Dreamliner

            The Dreamliner has made the point-to-point model much more feasible and has made opening less popular routes, like London to New Orleans possible. Compared to the hub and spoke model, point-to-point travel is cheaper for the consumer and the airline. The consumer no longer has to take multiple flights to get to their destination—and in the case of New Orleans often flying in the wrong direction to Houston or Dallas. Airlines incur fewer costs because flying out of an airport like New Orleans is cheaper than major hubs. Airport fees, ground staff, gates, and all the associated costs of flying are cheaper at a less traveled airport. Additionally, as fuel prices have dropped in recent years, fuel efficient planes like the Dreamliner are even cheaper to operate. And with an operational range of 8,000 miles, the Dreamliner can easily travel between different European and North American cities.

             The opening of the New Orleans to London and New Orleans to Frankfurt routes are the results of long term trends in the airline industry that will make travelling internationally easier and more accessible to people than ever before. 

Tuesday, November 1, 2016

November Movie Preview

            The big movie releases of October were largely disappointing. After building a lot of early Oscar buzz, Birth of a Nation underwhelmed and quickly disappeared from theaters. Meanwhile films like Inferno and The Accountant are mindless entertainment, but that doesn’t make them good. For those of us aiming at little bit higher when we go to the movies, November seems to have some better options.

November 4
Doctor Strange: It’s been months since Marvel has released a movie. If you care about superhero movies, you haven’t heard from the Marvel Cinematic Universe since the release of Captain America: Civil War in May. If you don’t care about superhero movies, then you’re ruing the appearance of yet another new Marvel superhero who will undergo a Joseph Campbell-esque hero’s journey, overcome a generic and vaguely threatening villain, and then find himself sliding into his predetermined role in the MCU. This time it’s Benedict Cumberbatch’s turn to take up the cape as Doctor Steven Strange. He becomes some kind of metaphysical wizard… eh who cares? This movie will make Disney and Marvel another billion dollars.

Hacksaw Ridge: Did you miss Mel Gibson? I didn’t think so. Well he’s back directing former Spiderman Andrew Garfield in a World War 2 movie about a consciousness objector who serves as a medic and wins the Congressional Medal of Honor. If Gibson wanted to get back in the good graces of Hollywood and the movie going public, a World War 2 movie with a handsome and idealistic young protagonist checks a lot of boxes for what counts as prestige drama these days. The problem is he’s still Mel Gibson and he still said all those horrifying things about the Holocaust. And his movies aren’t even that good, they tend to stuffed full of tormented men of action who brutally kill people in increasingly graphic ways.


November 11
Arrival: This is the first of the November movies worth seeing. In Arrival, Amy Adams and Jeremy Renner play a linguist and a mathematician respectively, charged with investigating the landing of a number of mysterious alien spacecraft around the world. Directed by Denis Villeneuve (Sicario, the upcoming Blade Runner sequel), Arrival has a mystery at its core: Who are these aliens and what do they want? Should mankind be afraid or welcoming? Undoubtedly, Adams and Renner will have to scramble for answers or deal with a military colonel (played by Forrest Whitaker) just in time to avert some kind of global disaster. If done well, this could be this year’s Martian only with higher stakes and less snark.

November 18
Fantastic Beasts and Where to Find Them: So that book about magical creatures mentioned in the Harry Potter series is now its own film franchise? And there’s going to be five of them? Five movies, about what? J.K. Rowling wrote the screenplay! Yeah and she also wrote some racist depictions of Native Americans on her website as a tie-in to the movie. That’s not a good sign. What is the reason for this existing other than to keep Warner Brothers studio afloat? Because you know this movie is going to make a ton of money. Fantastic Beasts just seems like an excuse to exploit the public’s love of Harry Potter for profit rather than serving any artistic purpose.


Manchester by the Sea: Manchester by the Sea deals with the story of a janitor (Casey Affleck) who after the death of his brother (Kyle Chandler) becomes the sole guardian of his nephew. Affleck then leaves behind his job in Boston and returns to the North Shore community of Manchester by the Sea to deal with his wife and the community he left behind. Currently, the film holds a 98% on Rotten Tomatoes and the consensus reads: “Manchester by the Sea delivers affecting drama populated by full-bodied characters, marking another strong step forward for writer-director Kenneth Lonergan.” And since it stars Casey Affleck you know he’ll get the accent right.

November 25

Moana: The latest Disney animated movie musical is about Moana Waialiki, the daughter of a tribal chief known for his navigating skills. In classic Disney fashion, Moana will have to follow her in family’s footsteps and make a dangerous journey across the Pacific Ocean. The film boasts some impressive behind the scenes talent including Dwayne Johnson and Alan Tudyk. Lin-Manuel Miranda, the creator of the Broadway megahit Hamilton, wrote the songs and lyrics. Disney is hoping that the money they’ve invested in rebuilding its animation studio will continue to pay off. 

Tuesday, October 25, 2016

2016 World Series Preview

            The Chicago Cubs last won the World Series in 1908. They last played in the World Series in 1945.  The Cleveland Indians, meanwhile, last took home baseball’s championship trophy in 1948. These World Series droughts of 107 and 67 years are the two current longest in baseball.  And in a little more than a week, one of them will be over. In light of this historic World Series that will salve the souls of one of baseball’s formerly moribund franchises, let’s take a quick look how these two teams match up.


Win-Loss Record
Runs Scored
Runs Allowed
Run Differential
BaseRuns Record
CHI
103-58
808 (3)
556 (1)
+252
107-55
CLE
94-67
777 (5)
676 (7)
+101
91-70

The Cubs had the best record in baseball this season and finished 3rd in runs scored and first in runs allowed. Cleveland won the AL Central division title before easily dispatching the Boston Red Sox and Toronto Blue Jays in the divisional and league championship rounds. They finished 5th and 7th in runs scored and runs allowed respectively. The telling statistic here is each team’s BaseRuns record, suggesting that Chicago underperformed relative to its record, while Cleveland overperformed.  BaseRuns records are based on a metric known as BaseRuns. BaseRuns estimate how many runs a team would be expected to score (or allow) based on their underlying performance. Because of factors out of a team’s control like luck, the number of runs a team scores isn’t always indicative of their true talent level, so BaseRuns tries to remove these factors. Looking at BaseRuns, Chicago was even more impressive than their 103 wins would indicate.

OFFENSE


AVG/OBP/SLG
Runs/Game
wOBA
wRC+
CHI
.256/.343/.429
4.99 (3)
.333 (3)
106 (3)
CLE
.262/.329/.430
4.83 (4)
.326 (7)
102 (6)

A simple comparison of each team’s batting average, on-base percentage, and slugging percentage suggests that they’re pretty evenly matched.  Chicago and Cleveland even finished 3rd and 4th in runs per game. A look at some of the advanced metrics like wOBA and wRC+, however, reveals that Chicago has the better offense. wOBA (weighted on-base average) is based on a simple idea—that not all hits are created equal. A home run is worth more than a single for instance. The formula uses linear weights to weigh the value of each hit and in this case, it reveals that Chicago has a bigger edge than it first seems.  wRC+ is a measure of offensive production that is weighted to league average of 100 and any digit above or below 100 is equal to 1% above or below league average. The Cubs with a wRC+ of 106 are 6% above league average, while Cleveland is only 2%, a small, but significant advantage.

PITCHING


AVG/OBP/SLG
ERA
FIP
ERA+
CHI
.212/.285/.348
3.15 (1)
3.77 (5)
128 (1)
CLE
.243/.304/.407
3.86 (7)
3.91 (8)
122 (2)

As we look closer at each team’s pitching staff, Chicago, again, has the advantage over Cleveland.  Overall, Chicago has held its opponents to much lower batting average, on-base percentage, and slugging percentage than Cleveland.  A simple look at these numbers is misleading, however, as Chicago plays in the weaker offensive league (no designated hitter) and as we will discuss below benefits from a better defense. Chicago also holds a significant edge in earned run average, but while ERA is one of the longstanding measures of pitching effectiveness, it’s too noisy to tell us much on its own. FIP (or fielding independent pitching) attempts to strip out the noise by taking out all of the things that pitchers can’t control (like defense) and focusing on those they can—like strikeouts, walks, and home runs allowed. A FIP based comparison suggests that Chicago and Cleveland are a little closer together than it seems. Looking at ERA+ (a similar statistic to wRC+, in that it takes ERA, adjusts it to league average of 100), the Cubs have the best pitching staff in the league, while Cleveland is second. Overall, the Cubs have the better pitching staff.

DEFENSE


DRS
UZR
DEF. EFF.
CHI
82 (1)
73 (1)
.728 (1)
CLE
17 (9)
35.6 (4)
.696 (6)

Finally, we’ll briefly cover the defenses of both teams. Defensive statistics have only recently come into their own thanks to the introduction MLB Statcast and better ball tracking software.  Nonetheless, there remains a wide disparity between advanced defense statistics, so it’s best to take a sample of a few different ones. DRS (defensive runs saved), an estimate of the number of runs saved by defenders over the whole season, has the Cubs rated significantly higher than Cleveland. In general, ten runs is the equivalent of one win, meaning the Cubs added about eight wins just by their defense. UZR (ultimate zone rating) similarly has the Cubs with the best defense in baseball by a significant margin. Finally, defensive efficiency (simply the percentage of balls put into play that the team turned into outs) has the Cubs as the best defense in baseball. 


PREDICTION: Given their advantages on offense, defense, and pitching, Chicago is the favorite to bring home its first World Series title since 1908. CUBS in 5.

Tuesday, October 18, 2016

Supermoon!

If the other night you looked out at the moon, surely you noticed that something was a little bit different. The moon seemed bigger and brighter in the night’s sky. That wasn’t some optical illusion, but rather a phenomenon known as a supermoon.  While the term has become more popular in recent years, it originally referred to a full or new moon that occurred when the moon was within 90% of its closest approach to Earth. Now it refers to a full moon that is simply closer to Earth than average.

The Supermoon peering above the horizon 

The moon has an elliptical orbit around the Earth, meaning that it is not always the same distance away from our friendly little planet. One side of the orbit, known as perigee, is about 30,000 miles closer to Earth than the other side, known as apogee.  As the Earth, moon, and sun perform their astrological dance around one another, at a certain point in the movement of all three an event known as a syzygy occurs.  It’s the scientific name for when the Earth, moon, and sun line up as the moon orbits Earth.  Syzygy occurs when the moon is in perigee (closer to the Earth) and in apogee (farther away). The supermoon occurs when the moon is on the opposite side of the Earth from the sun and is in perigee.

The latest supermoon was just the other night on October 16, 2016 and there will be two more over the next two months on November 14 and December 14.  November 14 will be a special supermoon as moon will be at its closest point of perigee. It will be the closest of the three and the closest the moon has come to the Earth in the 21st century. It won’t come this close again until November 25, 2034.  Not be left out, the supermoon on December 14 will block out the Geminid meteor shower set to occur that evening. Normally the falling pieces of rock illuminate the night sky, but thanks to the increased brightness of the moon, they’ll disappear from sight.


A supermoon can be as much as 14% bigger and 30% brighter than a regular full moon. Sometimes though, it’s hard to tell the difference. A 30% difference in brightness can easily be masked by clouds or lights from homes or streetlights. When the moon is high in the sky, it can be hard to tell the size difference without a reference point to provide some measure of scale.  When the moon is low in the sky, it can create a ““moon illusion.” Near the horizon, it can appear larger when viewed through trees, buildings, or other objects in the foreground. The effect is an optical illusion, but it’s still impressive.


So if you missed the supermoon this week, don’t worry there’s still two more chances this year to observe this astronomical treat. 

Tuesday, October 11, 2016

Saints Quarter Season Check-In

            Coming off their bye this week, the New Orleans Saints currently sit third in the NFC South with a record of 1-3. They’re a half game ahead of the 1-4 Panthers and two back in the loss column behind the division leading Atlanta Falcons. As is our tradition, let’s check in on the Saints season so far. New Orleans has scored 114 points and allowed 130, good for a point differential of -16. Based on their Pythagorean win expectation (a modified version of the Pythagorean theorem based on points scored and points allowed that is better at predicting win-loss totals than actual win-loss totals), we would expect that the Saints would have a record of 1.7 wins versus 2.3 losses. While the four game sample size is rather small, this figure suggests that they’re a little bit closer to a 2-2 team than their 1-3 record suggests.

Wait, I thought there wouldn't be any math! 

            After Week 4, New Orleans ranked 18th in Football Outsiders DVOA metric (defense-adjusted value over average compares the result of every play against league average and turns it into a percentage 0= league average). Their offensive DVOA of 10.3% is sixth in the NFL and their defensive DVOA of 13.8% (on defense positive percentages indicate below league average) is 27th in the league.  Their special teams, meanwhile, sport a DVOA of -3.2%, 23nd in the NFL. In other words, the Saints have a really good offense, bad defense, and bad special teams. If you’ve heard this story before, it’s because this is the story of the Saints the last few seasons. Now let’s take a closer look at the New Orleans offense and defense.

SAINTS OFFENSE


Total DVOA
Passing DVOA
Rushing DVOA
2016
10.3% (6)
18.8% (14)
3.0% (8)
2015
10.5 (7)
30.1% (7)
-7.1% (15)

Comparing the Saints offense through four games this year, we see that overall they’re doing about the same compared to 2015, but the way they’re getting there is different. Through four games the Saints passing attack is less effective than in 2015, but their running game behind Mark Ingram and the offensive line is much stronger. Much of that improvement has come from two specific areas of play. The Saints rank first in the NFL Power Success according to Football Outsiders. Power is the percentage of runs on 3rd or 4th down with 2 or fewer yards to go that resulted in a first down or a touchdown. Saints running backs have similarly been stuffed—tackled at or behind the line of scrimmage—the fewest times in the NFL. This means more first downs, longer drives, and generally more points.

Let’s go a little bit deeper and look at the Saints stats per drive this season and see how they compare to last year.


Yards/Drive
Points/Drive
Turnovers/Drive
Starting Field Position
2016
36.51 (6)
2.63 (3)
0.093 (9)
27.44 (18)
2015
37.09 (2)
2.24 (6)
0.109 (13)
26.33 (21)

Again the similarities are pretty clear.  They’re top 10 in yards per drive and points per drive. Despite often playing from behind, they don’t turn the ball over at a debilitating rate—part of that is a function of the fact that they have so many drives in the first place. Unfortunately for New Orleans, their special teams rarely gives their offense great field position, meaning the Saints have farther to go to drive the ball down the field.


SAINTS DEFENSE


Total DVOA
Passing DVOA
Rushing DVOA
2016
13.8% (27)
23.9% (25)
-0.5% (24)
2015
26.1% (32)
48.1% (32)
-2.4% (27)

While the Saints showed defensive coordinator Rob Ryan the door midway through last season, the defense under Dennis Allen hasn’t been that much better.  Going from 48.1% below league average on passing defense to 23.9% below league average is an improvement, I guess, as long as we define improvement from going from historically awful to just plain awful. More likely though it’s just regression to the mean—after all it’s really hard to be 48% worse than league average two years in a row. After last year’s secondary featured veterans Keenan Lewis, Brandon Browner, Jarius Byrd, and Kenny Vaccaro in starting roles, this year the Saints have given playing time to undrafted rookies like Ken Crawley and De’Vante Harris. They signed veteran corners Sterling Moore and B.W. Webb off the street in recent weeks. Second round pick Von Bell has supplanted Byrd, yet another of Mickey Loomis’s failed free agent signings, as the starter. In other words, don’t expect things to get better any time soon.


Yards/Drive
Points/Drive
Turnovers/Drive
Starting Field Position
2016
39.40 (28)
2.67 (30)
.140 (12)
28.60 (20)
2015
38.62 (32)
2.64 (32)
.119 (19)
26.75 (11)

A look at the drive stats for the Saints tells a similar story. In 2016, they’re allowing similar numbers of points per drive and yards per drive as they did in 2015. In other words, you’re seeing a 2016 Saints defense that looks a lot like the 2015 one. And if that’s the case, then it’ll be another long season ahead for Saints fans.